Welcome to learning to scalp the SPY Futures Index market! This article will walk you through a process and mentor you along the way as to how to think of the markets, what things actually matter when day trading and best things to avoid. We will begin by diving deep into psychology of a trader as that is the most important aspect to being successful in the markets and then we will walk through the actual trading strategy, explaining each thing as much as possible until you understand where we place trades with full knowledge as to why. This article will need to be re-read multiple times and if you are serious about taking up day trading for a living, you should immerse yourself in this article and videos every single weekend. That being said, lets begin.
The markets will challenge your inner self harder than anything else ever will. In order to become profitable in the markets you must become very self aware and learn everything about yourself. Who you currently are as a person, habits, thinking patterns and fears. You must understand your level of patience, determination and motive for wanting money. Are you an aggressive or calm type of person? What are your beliefs about money, yourself and the world? All this things will play a key role on whether you become profitable day trader fast or not. If you are not primed with the right beliefs and characteristic traits, it will take months and years to become a consistent profitable trader as the market teaches you all those things with time.
“If you want to be a great trader, you must be a robot. You can not have any emotions towards money at all, as it is simply a tool and nothing else.”
You can not have a love for material things as this will impact you when you have losing days, weeks or maybe you made a huge mistakes and takes you out completely and have to start over. This is a very common mistake and it happens to everyone, the most successful hedge funds and traders have all blown many accounts, it is part of the process but you can not let it get to you.
Psychology Of A Trader
90 percent of being a successful day trader is psychology, the other 10 percent is mastering the technical side of things.
FEAR.
Fear will creep up in many ways, it will creep up on you based on how you are because often times our fears are simply a reflection of ourselves not the situation we are dealing with. While some people are afraid of losing money, others are afraid of missing out on an opportunity. This simple fact and differentiator between traders will impact how they approach the markets, especially when its time to execute the trade. Will you have the courage to risk the money or will you hesitate to pull the trigger and watch your trade run without you. Fear in this case often comes from not being certain about a direction on the markets. Fear is always a results of uncertainty, as most people are afraid of the unknown and geting out of their comfort zones because of what they might encounter. This is why earlier I mentioned that you must be very self awared and know all of your motives for trading and also learn to question every single emotion, as not doing so could make you to be reactive to market movements instead of feeling in control and aligned with yourself internally.
The best traders plan their trades and wait for the opportunity to reach them, while amateurs react constantly to the noise of the market. The best traders can wait for 3 or 4 hours watching the market move and not be tempted to place a single trade. Some traders have to wait days or weeks before engaging on a set up if they are trading the higher timeframes. The best traders plan their trades and not react to the noise which requires long term, analytical thinking, strong gut instinct and most importantly, trust in yourself and your own abilities.
Fear can also show up when you need to make money quick, because you can not afford to lose money, which leads to every move against you making you want cut the trade even if a few seconds laters runs to your take profit. This pattern of fear is one of the most deadly for trading as it will not allow you to trade freely and actually risk the capital needed to get money. That is why the markets are not your place to get quick cash, but more of a way to accumulate wealth if you’re truly interested in the markets and have a passion for understanding the world as a whole. This means macro-econmics, world events, data about the country economy, diagnosing why those numbers happened, best stocks and why those stocks mattered and constantly analyzing their performance as that is what makes up the SPY Index.
Your upbringing will also play a key role on how fast you learn to master yourself and trade profitably consistent in the markets. If you grew up on an unstable home with alcoholic parents and violence, this will play a role on why you hesitate to trade, can’t control yourself or why you are over aggressive in your trading. On a later sub chapter, we will discuss why your upbringing will play a key role and why it is important to heal that as much as possible and how to do that so that you can get up and running fast.
Greed
The markets are driven by fear and greed at its most fundamental level. People are fearful the market will collapse or have a downturn and so they sell it making it move lower or stop its upwards movement. Other investors think the market will continue upwards and so they buy wanting to maximize their every penny and so they become greedy by holding until its last moment. You do not want to be dominated by neither as an independent trader. Your job is to identify where big money is placing their bets early and ride the wave through pattern recognition and momentum, and then simply take your pre-determined profit points with no regrets or wanting to be perfect.
Greed will appear when you are driven to make money, as opposed to mastering the art of the markets. If you are not interested or intrigued genuinely by the markets, you will lose and quit right away. Big hedge funds who are managing Billions of dollars and are heavily invested in shaping the world, gaining returns for their clients and taking charge, will run over you.
Understanding Your Upbringing
When you are born, your brain is like a brand new computer with no beliefs, experiences, trauma, data or knowledge of anything. As you grow up, you will begin to develop patterns for survival, performance, self care, dieting, fitness, values, principles, among many other things. Based on how you’ve ran your life up to this point, the choices you’ve had to make or chose to make, will affect how you react to opportunities when they present themselves. This will dictate your hesitation, aggressiveness, patience, motives, determination, focus, and level of engagement on interests that you take on things.
For example: If you grew up in poverty but with very strong family values and dynamics, always played sports or made things with your siblings, cousins and neighoorhood friends outside of your house. You will likely be motivated to uplift your family and teach your mates how to be prosperous, making you a leader. This will inspire you to learn faster, better and be more patient, determined and driven.
Now lets take peek at the opposite, someone who had no family, live in poverty and struggled to get by. They will simply want success for themselves to show off to parents and those who he believes let him down or neglected him. Who do you think will probably be prosperous faster? The first or the second type of person? If you guessed the first one, you are correct. The second type of person will take longer to unlearn and heal his inner self and then develop the right level of patience, mindset and self love that is required to have a clean and empty mind that will allow them to see things clearly.
I started this article by saying that the markets will challenge your inner self harder than anything else ever will. If you want to become a consistent profitable trader, the level of inner peace, right motives, characteristic traits and passion you have to develop will take time as you undo your trauma and align your inner self properly.
From Steve jobs to some of the most successful people in the world, have all preached the value of simplicity. Having a simple life will give you a clean mind and that is one of the main reasons why you are or are not focused, creative or posses the drive internally to work hard consistently to reach your goals. In the markets, this lifestyle can be the difference between having complete financial freedom from anywhere in the world working a few hours on your laptop or not having that freedom and sticking to a day job until you decide to change your internal home and motives.
How To Heal Yourself Internally
A great way to heal yourself is by simply getting honest with yourself. As mentioned previously, most people fail in trading and in life because they can not be fully honest with themselves and fail to admit their mistakes. Failing to truly, genuinely listen to the subconscious mind letting you know things you do not wish to hear will lead you to never healing and live in alignment from mind, body and soul. Listening to those voices is a very key component to living in peace overall but also align yourself with your real desires and the more that you spend time there, it could develop your internal dialog so that you build courage to execute on those desires. You will literally have to sit alone every day and question why you placed certain trades that led to losing or winning. You will always learn more from your loses, by the way. Question yourself about why you chose to place that trade, what was going on inside your head at the time, and how you can be better next time. Write it all down and be truthfully honest on your motives, even if you makes you look bad, amataur or a person motivated by dark motives such causing jealousy to someone or whatever. Write it all down and work from there, it will free you and you will be able to perform much better over the weeks following that.
Who You Currently Are
Your personal life will affect your trading profession tremendously. A chaotic girlfriend, a bunch of friends filled with drama and negative energy or simply just having a bunch of friends, period can impact you enough to play a key role on whether you’re successful or not. If you are emotionally unstable, unhappy, unorganized or unclean, it will plague your mind with anxiety, fears, greed or other emotions that you do not want controlling or influencing you as you take very high frequency trades such as scalping the SPY. Entertaining one thought from a conversation with a friend or girlfriend can distract you enough from staying focused on what your looking for in the market and what the outcomes are as the opportunity nears to execute your well crafted plan for the trade. This will lead you to feeling certain emotions based on those conversations which will influence whether you enter the trade or not.
The best traders in the world, those trusted by Goldman sacks with Billions in their portfolio all have very simple, organized, clean lives that allows them to put in hundreds of hours seeing the markets and disecting it. They spend lots of time researching, thinking and seeing all aspects of the world and economic events then getting in tuned with their instinct to trust the best path forward. Through social media we are lead to believe that daytraders can party, do drugs, drink and live in strip clubs while trading, this is far from the truth. Those people simply became that way after they mastered themselves and began earning money, but those are the ones who make mistakes and eventually fail. That is why I am inviting you live simple, not run away from emotions but rather question them, get honest with the answers and improve from there. This will alignment you and become a strong anchor for when facing turmoil and negativity in markets as well as in life.
Find Appreciation
Learning to appreciate the journey, yourself and finding joy and pleasure on the little things will serve you well. Like mentioned, Ignore those successful traders on Instagram going to strip clubs, living in Dubai penthouses and driving lamborghinis, as they have already overcome the lonely journey, mastered themselves and trained their eyes to identify the right patterns. Remember that the best traders have developed the patience needed to consistently wait for set ups to appear for them as opposed to chasing them. Having a stable family life, contributing to people and things will give you something joyful to fall back on when you have a bad day, weeks or overall hard times.
Now that you’ve learned about psychology, why it matters and how it plays a huge role on whether you will be successful in trading long term or not, lets dive into the other 10 percent that makes you a successful trader, learning how to break down and analyze markets and trade setups.
Candlesticks
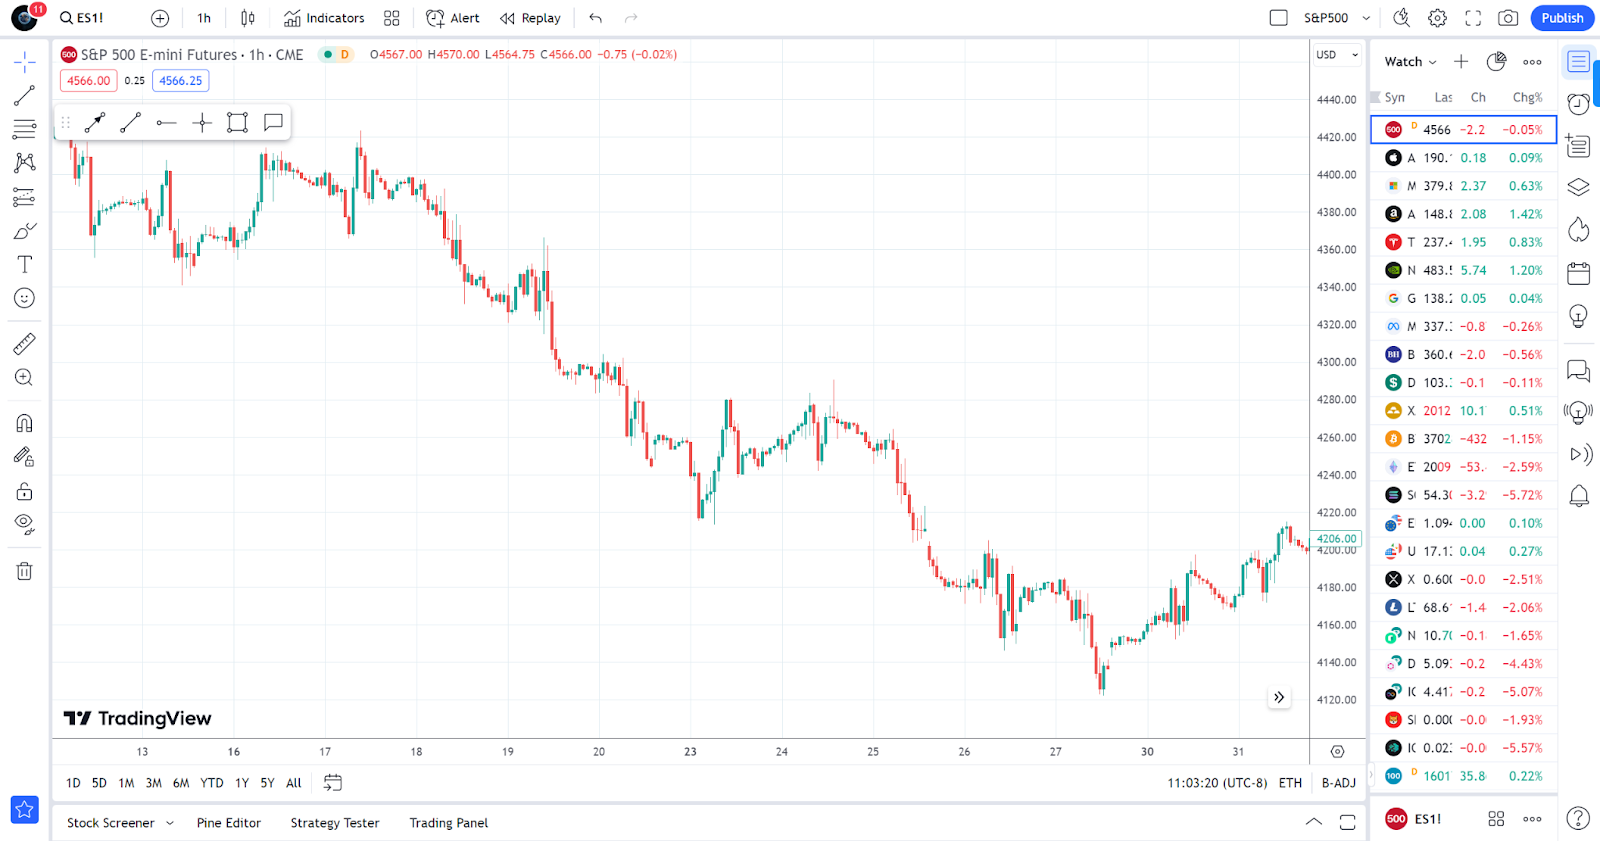
When you open up a trading platform, you will have the option to select the type of graph you want to analyze an asset on. You want to choose the candlestick charts as that allows you to see real time volatlity, volume and is the easiest way to spot when a breakout occurs. When trading the SPY or SPY Mini (ES1 Mini) the candlestick chart will be the only type of graph you want to analyze the market with and place trades on. Trading this chart will allow you to see the price movement be very rapid, this is called price action. If you go to the ES1 or ES1 Mini in any morning of a weekday on the platform found at tradingview.com and go down to the 5 minute chart, you will see price move fast.
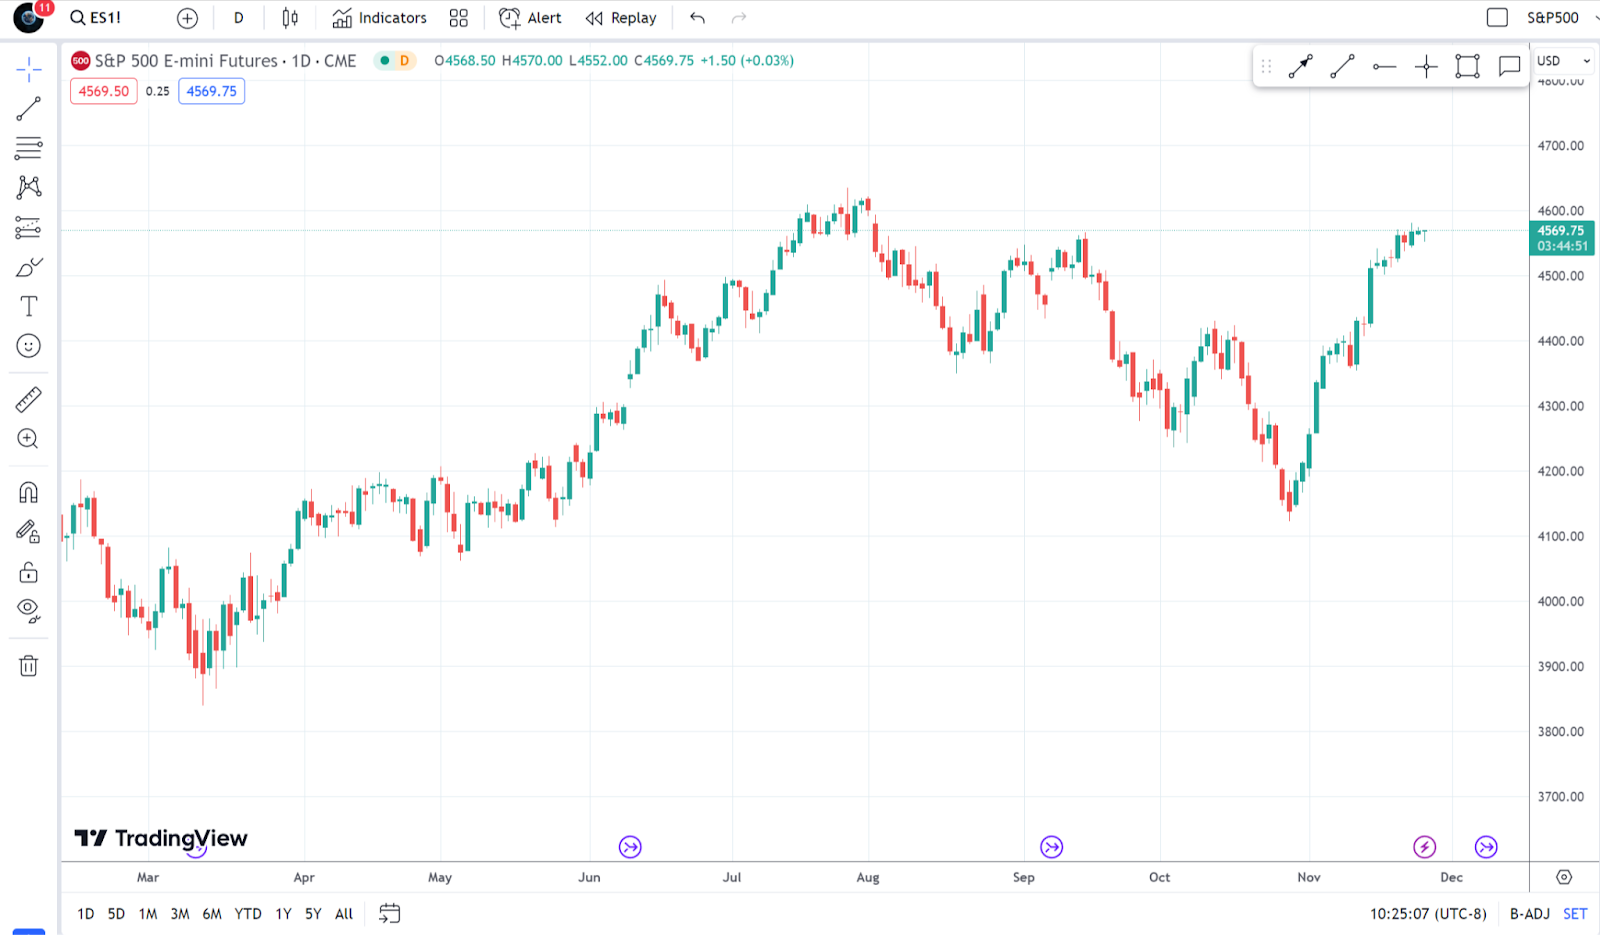
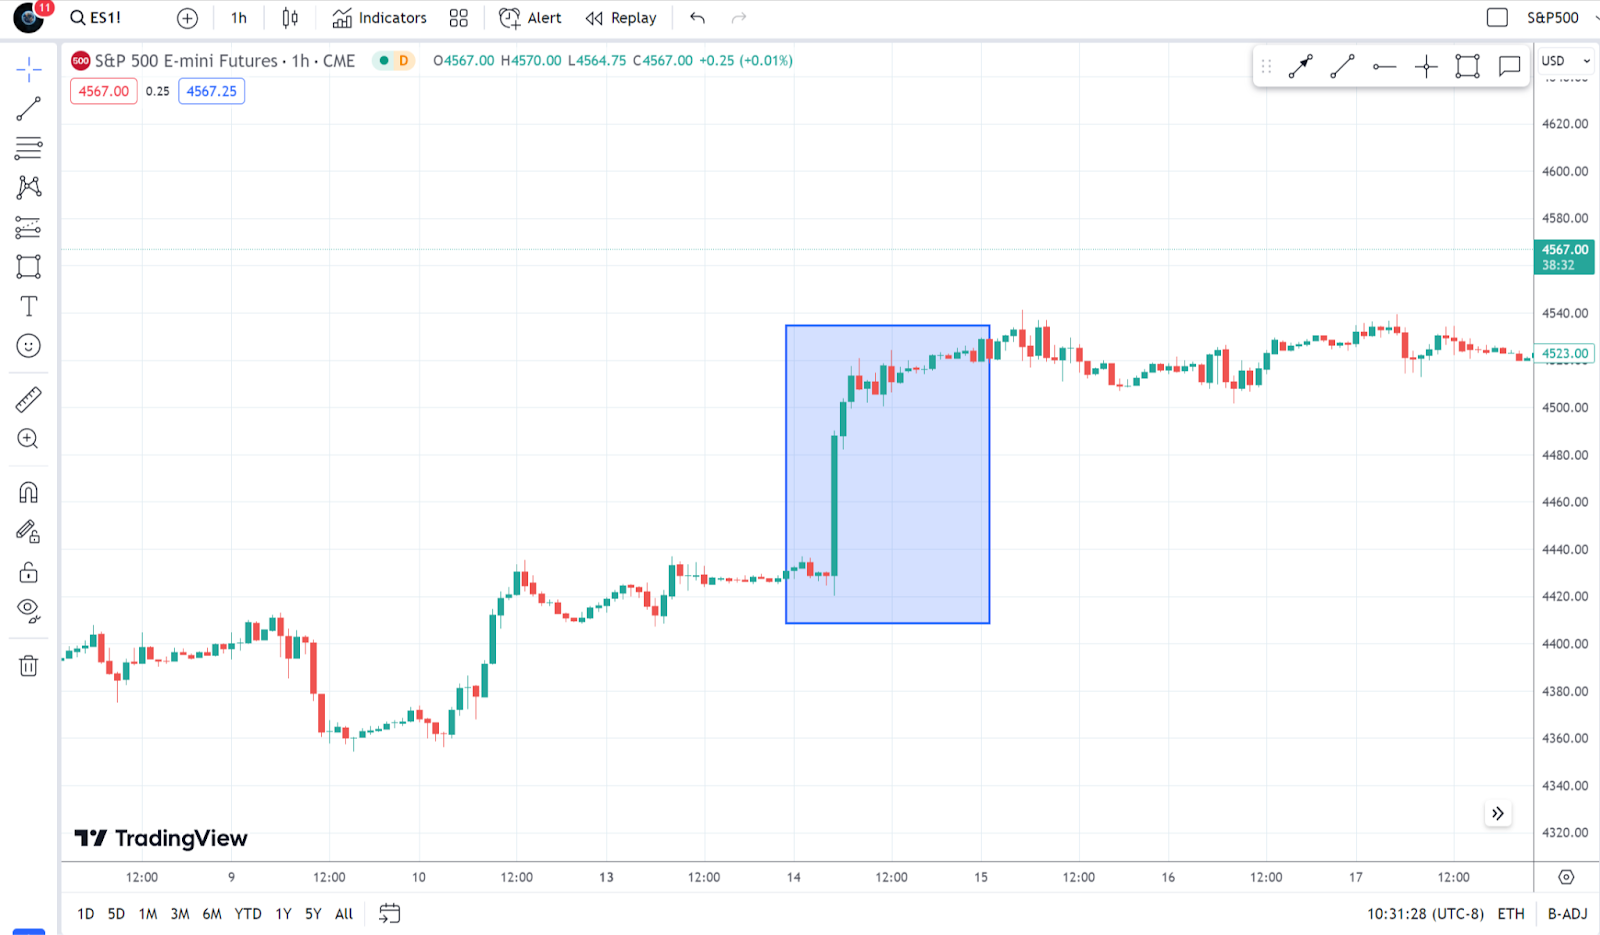
As you can see on the image above, this is how the candlestick chart will look like.
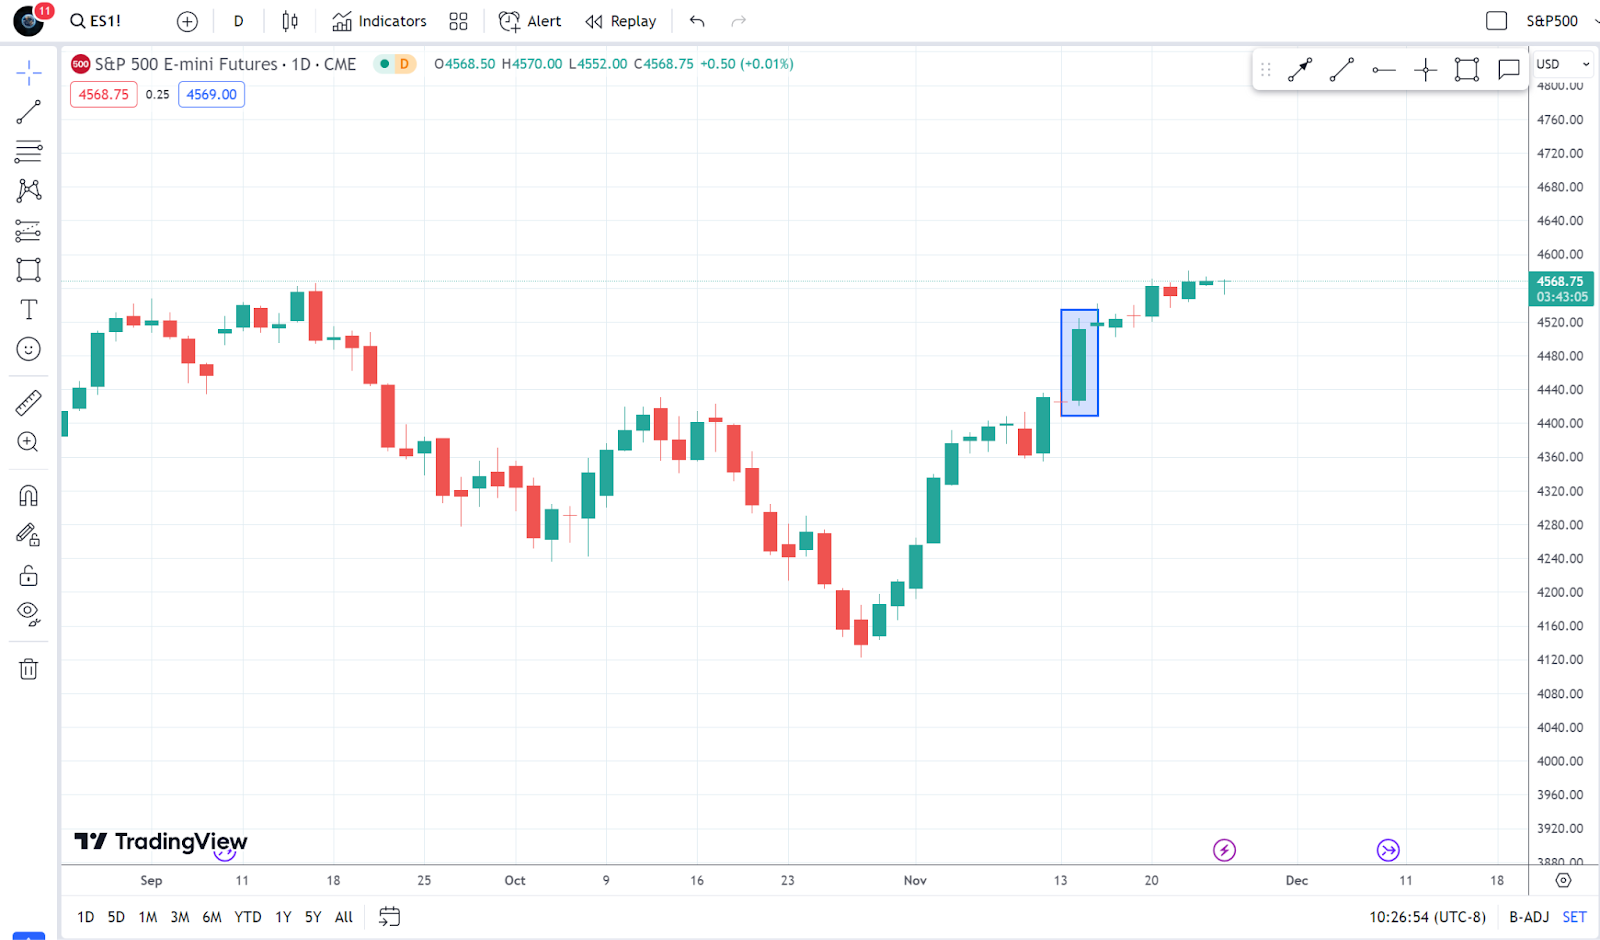
Daily Timeframe Candlestick.
The bar inside the blue box is a single candlestick, which in this case represents one whole day worth of data as we are currently looking at the daily timeframe of this chart and asset. A timeframe on a candlestick chart, simply represents that each candlestick holds a certain amount of data relatively to its timeframe. More on this topic as you continue reading, for now lets continue focusing on the candlesticks only, it will all come together at the end, I promise.
Each bar on this current candlestick graph, which is the daily timeframe, is made up of 24 hours which are 24 candles on the 1 hour timeframe. So when you see a candlestick that moved up 6 points and came down 12 points and closed the day 2 points up from where it opened, that means the market is indecisive on which way to move. The amount of traders being greedy wanting more movement in the same direction and the amount of traders being fearful, taking out profits at that level were fairly equal making the market only closed it 2 points above its open price but with big quantity of transactions during the day moving it up 6 points and down 12 points. This create what is called a doji candlestick.
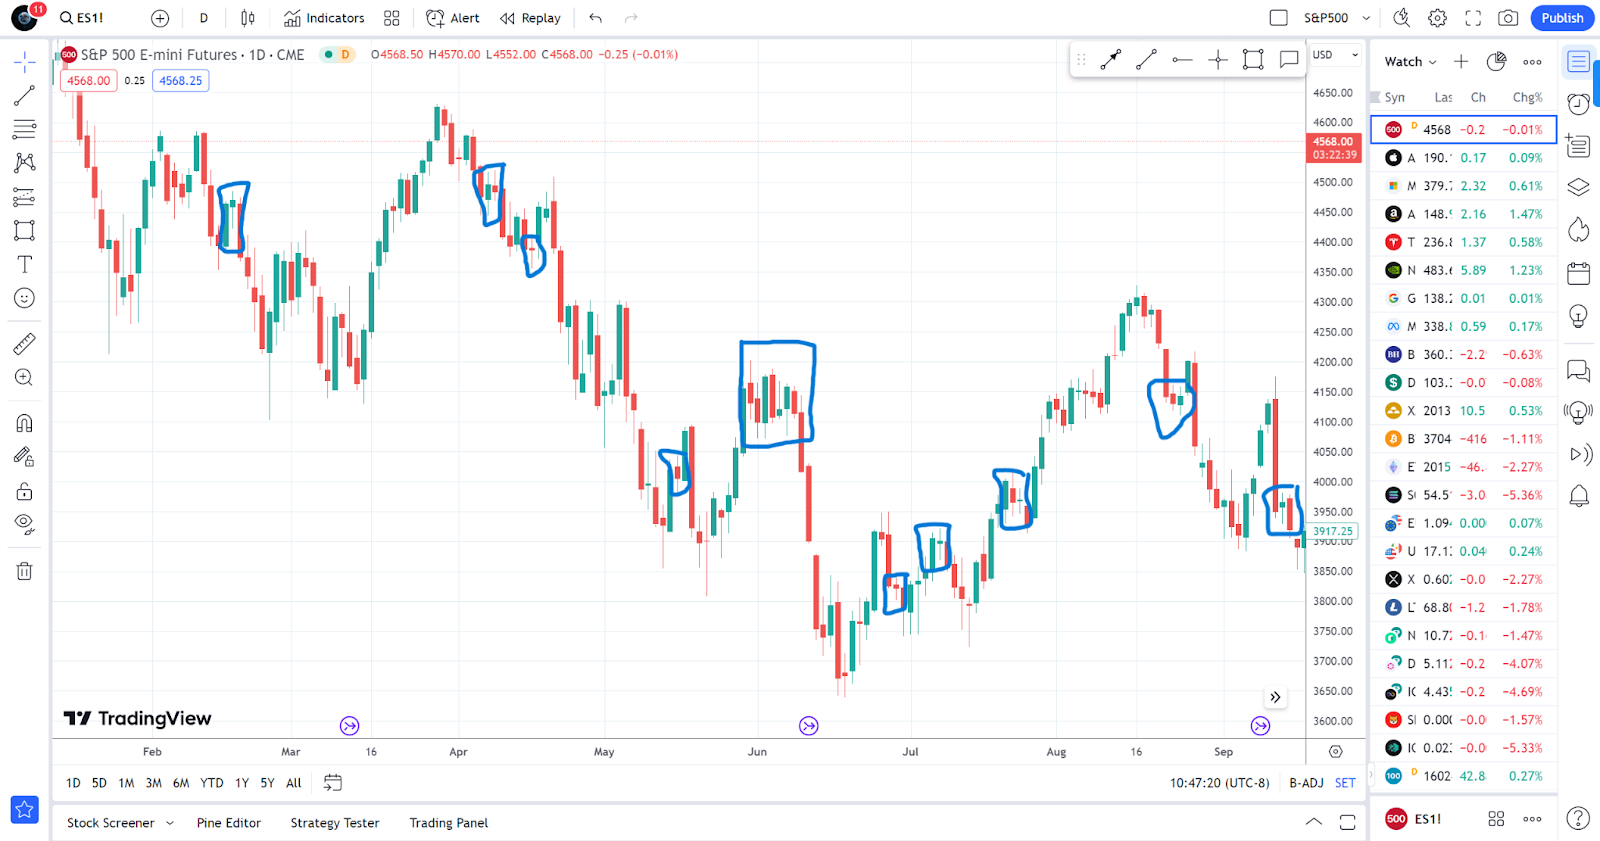
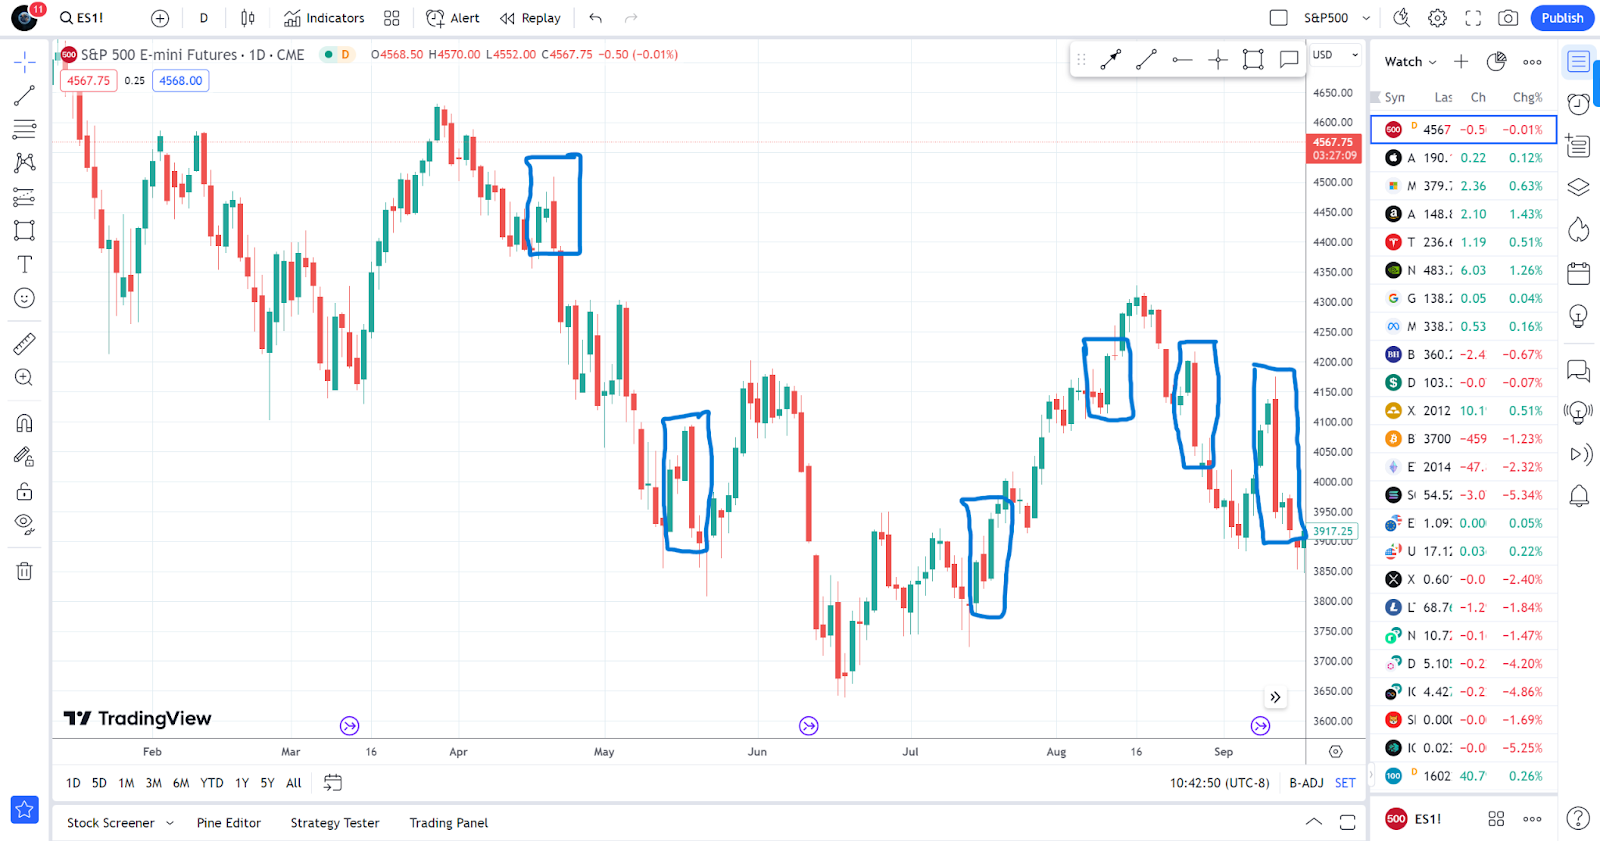
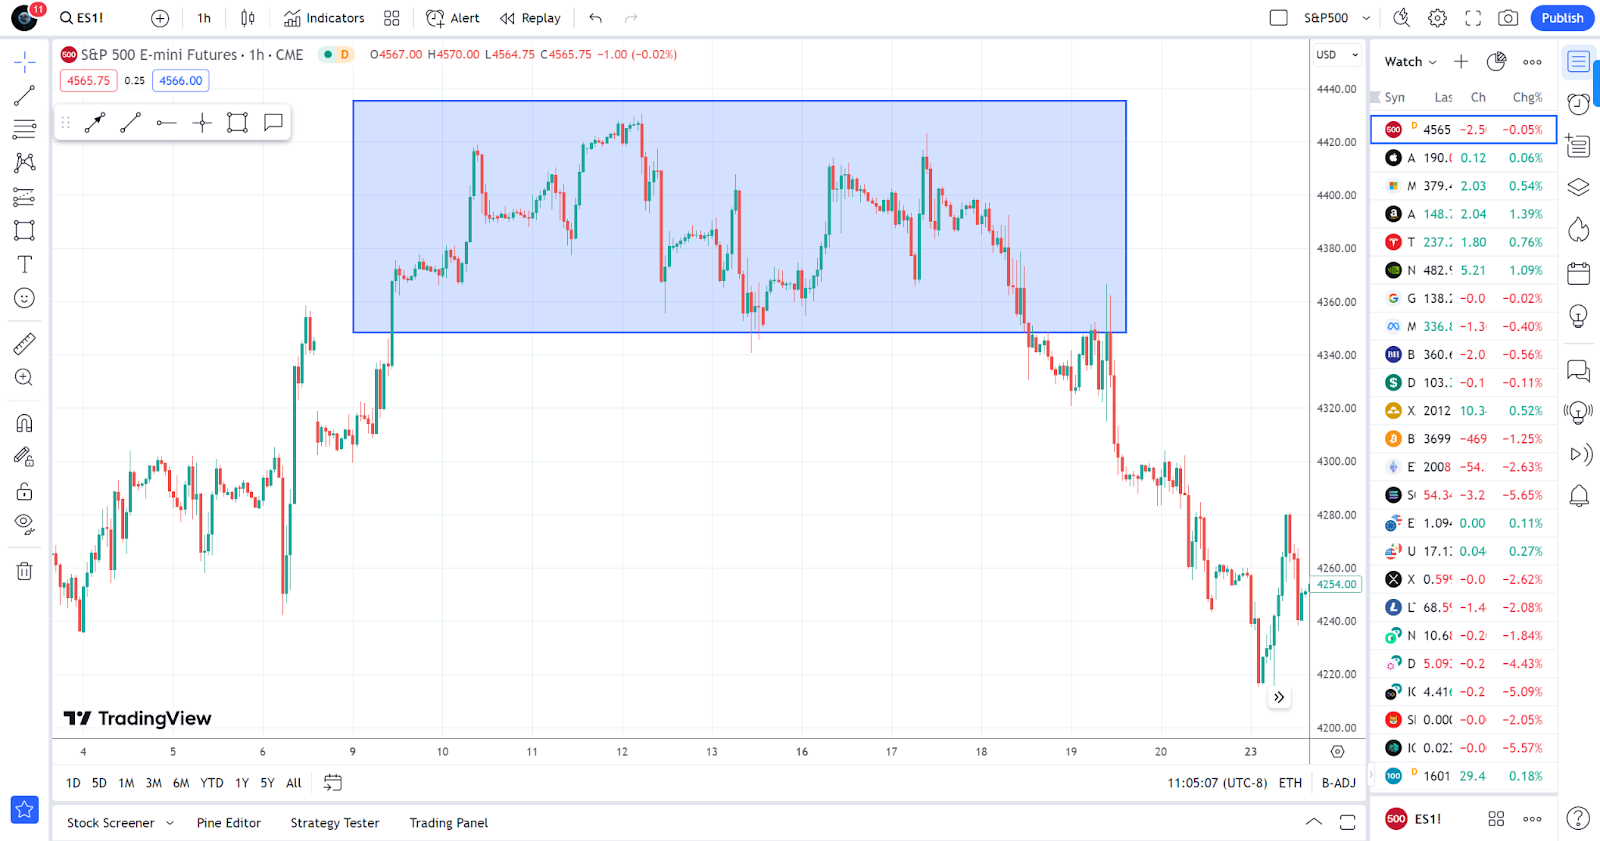
Doji Candlestick In Chart
This image has a couple of blue squares and inside those blue squares contains a doji candlestick. Below you will see closer what a doji candlestick looks like.
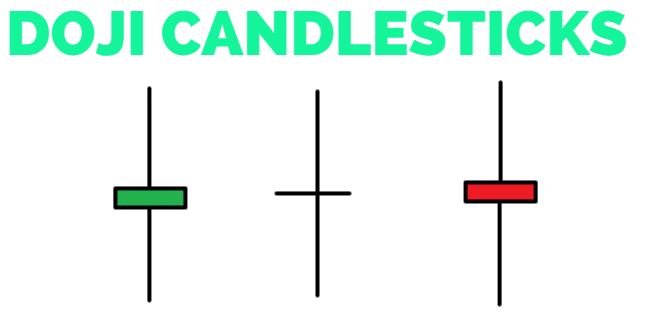
Doji Candlesticks Examples
1 Hour Movement, Inside Daily Timeframe Candlestick Image
Inside a Daily timeframe of a candlestick chart, there are 24 candlesticks because there are 24 hours in a day as mentioned. Inside the rectangle looking at the image “Daily Timeframe Candlestick” you can see the 24 hours for that one daily timeframe candle shown just above this writing. That is the total movement that happened in that day in the hourly timeframe, and if we go to a 15 minute timeframe you would see a different movement and many more candlesticks inside that blue rectangle because it would take 4 candlesticks of 15 minute to make up the 1 hour, which are 24 hours to make up a daily candlestick. Smaller timeframes make up the big timeframes but when it comes to actually placing trades, you want to wait for higher timefreames to show signs of a clear movement so you can ride the wave and profit from small movements in that direction. You will learn more throughout this article and in the multi timeframe analyzes part, keep reading.
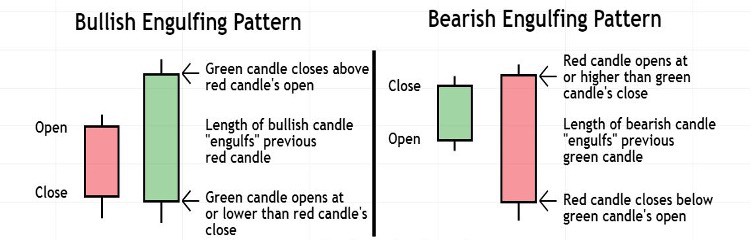
Another candlestick that you want to memorize besides the doji, is called the engulfing candlestick. This candlestick pattern will allow you to see where big hedgefunds and investors are placing trades or betting heavily on a market direction. Remember, as a trader you want to wait for such movements and market to show opportunity. Amateurs chase trades, professionals develop a plan, and wait patiently for market to align itself to their plan before placing any trade.
The image above spots Engulfing candlesticks. This means that most traders have taken control of the market. Below you will see a more closer look at that candlestick.
Trends
Now that you’ve learned what candlesticks are and why they matter, lets dive into learning how to spot market direction. You would never run towards a fast train coming at you, so why would place trades against a strong market direction? A key thing to always have in mind is acknowledging that the market moves in waves. The market will never move in any one direction forever or even for a long time, this is particularly true in smaller timeframes. That is because there are many kinds of traders from long term investors, long term traders, swing traders, day traders and scalpers. Each places trades based on certain criteria and timeframes and therefore take profit at their appropriate levels.
Scalpers move the markets on very short, high frequency timeframes such the 5 minute chart or the 2,000 tick charts as for the ES1 or ES1 Mini which is what you’ll be learning here. While a swing trader looking at the ES1 on a 4 hour timeframe might see a market consolidation, waiting for a breakout, which could be 20 points away, while a scalper is making high frequency trades on shorter time frames by spotting small trends and profiting around 2 points there. Everything you are learning here is to prepare you to trade short timeframes, you can actually apply this same philosophy and trading strategy to higher timeframes as well. It will simply require more patience and time for markets to develop there which if you do not have a patient personality, you might struggle and execute trades prematurely just to get a rush from participating in the markets which is not a strategic approach.
The Three Market Cycles
As mentioned, the market moves in three different cycles, upwards, downwards or consolidates sideways.
Uptrend Market
As mentioned previously, the market is driven by fear and greed or optimism and pessimism. If the big timeframe on the daily chart is moving upwards, it means that big banks such goldman sacks, jp morgan and others are betting on the long term prosperity of the market, this movement can last weeks or even months.
Those banks and financial institutions are the ones investing your social security money, the savings in your bank account and any money they can get ahold of. They diversify their asset allocation through different markets sectors and because of their non liquid asset bets, they have to always keep pushing the market upwards as they have to grow their retirees account balances to ensure elder people don’t live in poverty once they retire.
Downtrend Market
If the market is moving downwards that means that those same banks are fearful of a market recession and are playing very conservative as they wait for government, policy or the federal reserve to do something that will impact the money circulation of the country in a positive manner. Remember that banks invest heavily on independent stocks and indexes among other things and private equities are mostly buyers of real physical assets or holdings which are not as easy to get out of as per say, a trader placing an electronic trade to purchase a few shares of a company from the stock market and holding for short periods of time.
Consolidation / Sideways Movement
Consolidation or a sideways market means that there is a big indecision on whether the market is healthy and prosperous or failing and declining. Usually the market remains moving because of short timeframe, high frequency traders trying to capture small moves through any news that might be coming out from key companies that could cause small but somewhat certain market direction. Therefore moving 10 points on a day up or down could make a well trained professional short frequency trader 2 to 4 points profit.
Before you even think of placing trades or doing any analyzes, you have to spot and ensure you know which way the market is moving.
Day trading but more precisely, scalping markets is the only way to still make real hard cash money no matter what the entire world economy is doing. It is the only way you can secure your family, yourself and claim your total financial independence without worrying. Mastering to read and identify this candle sticks and using them to your advantage alongside the other things that we will be learning next will be your biggest advantage to being great in the markets.
Multi Timeframe Analyzes
When it comes to analyzing the market, it is crucial that you do not ignore the big picture of what is happening on the technical side of things. Lets say you are a scalper, someone who trades short high frequency timeframes which is what you are learning in this article. If you are only looking at the market from one angle or point of view which equals to one timeframe. You might see an opportunity in the 5 minute chart stating that the market will move up but if you take a step back to look at the big picture such as the hourly timeframe, you will learn that the higher timeframe is showing the complete opposite. Like mentioned earlier, you do not want to trade against the overall trend, especially the trend that is developed one or two timeframes above the one that you are executing your trades from.
Remember that the most successful traders in the world do NOT chase trades. They create a plan and wait for the markets to play out, reach their entry levels and then wait some more for confirmation before engaging. Independent day traders are simply speculators of the markets, waiting for signs from big hedge funds and banks to create momentum and we ride behind that movement very strategically.
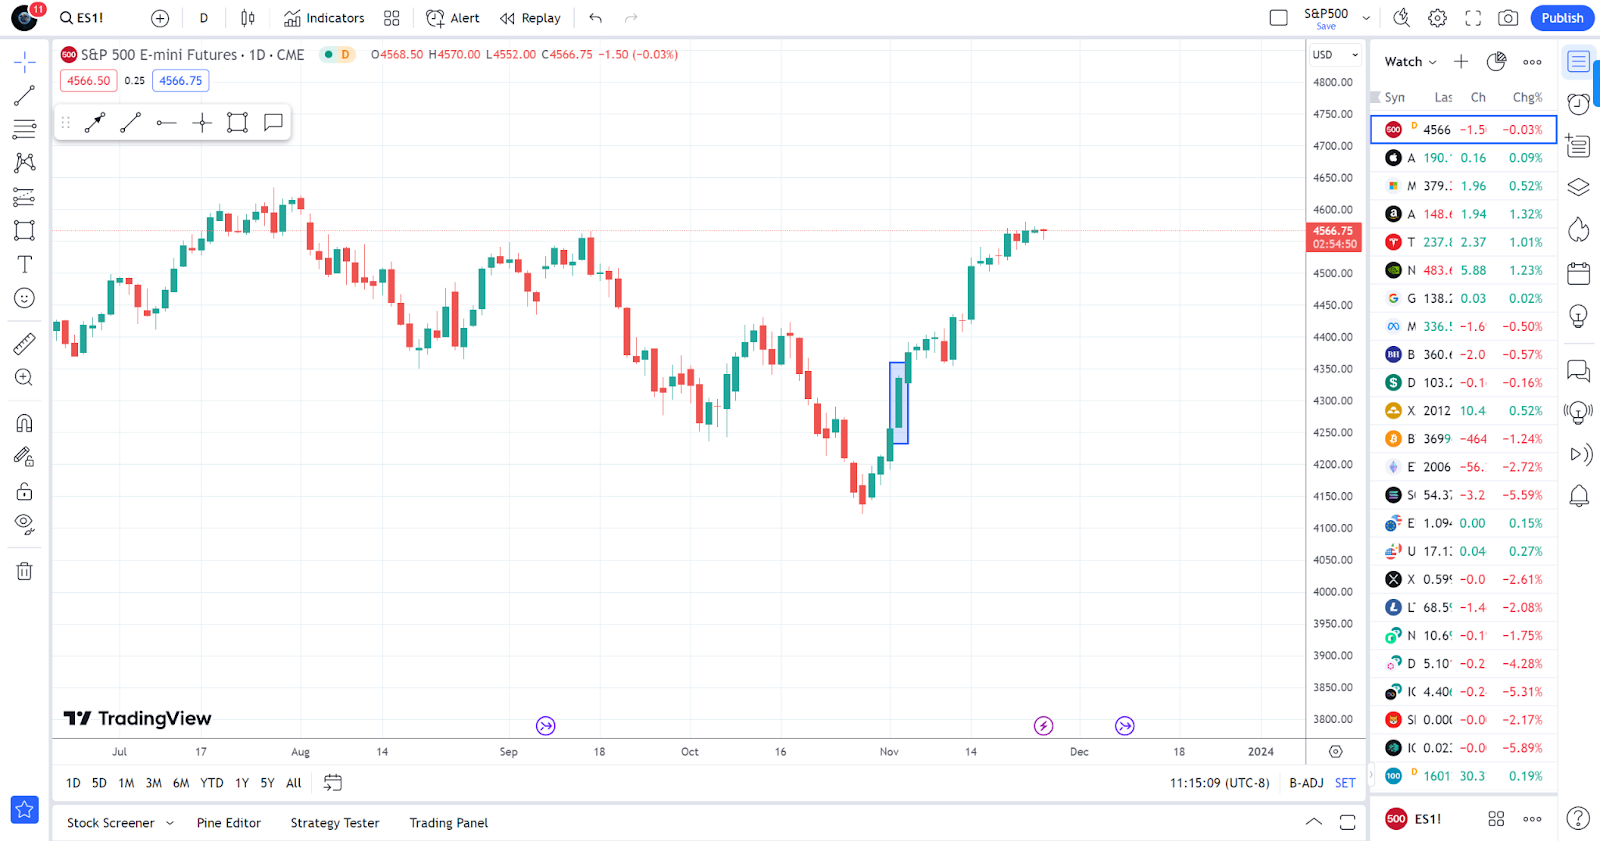
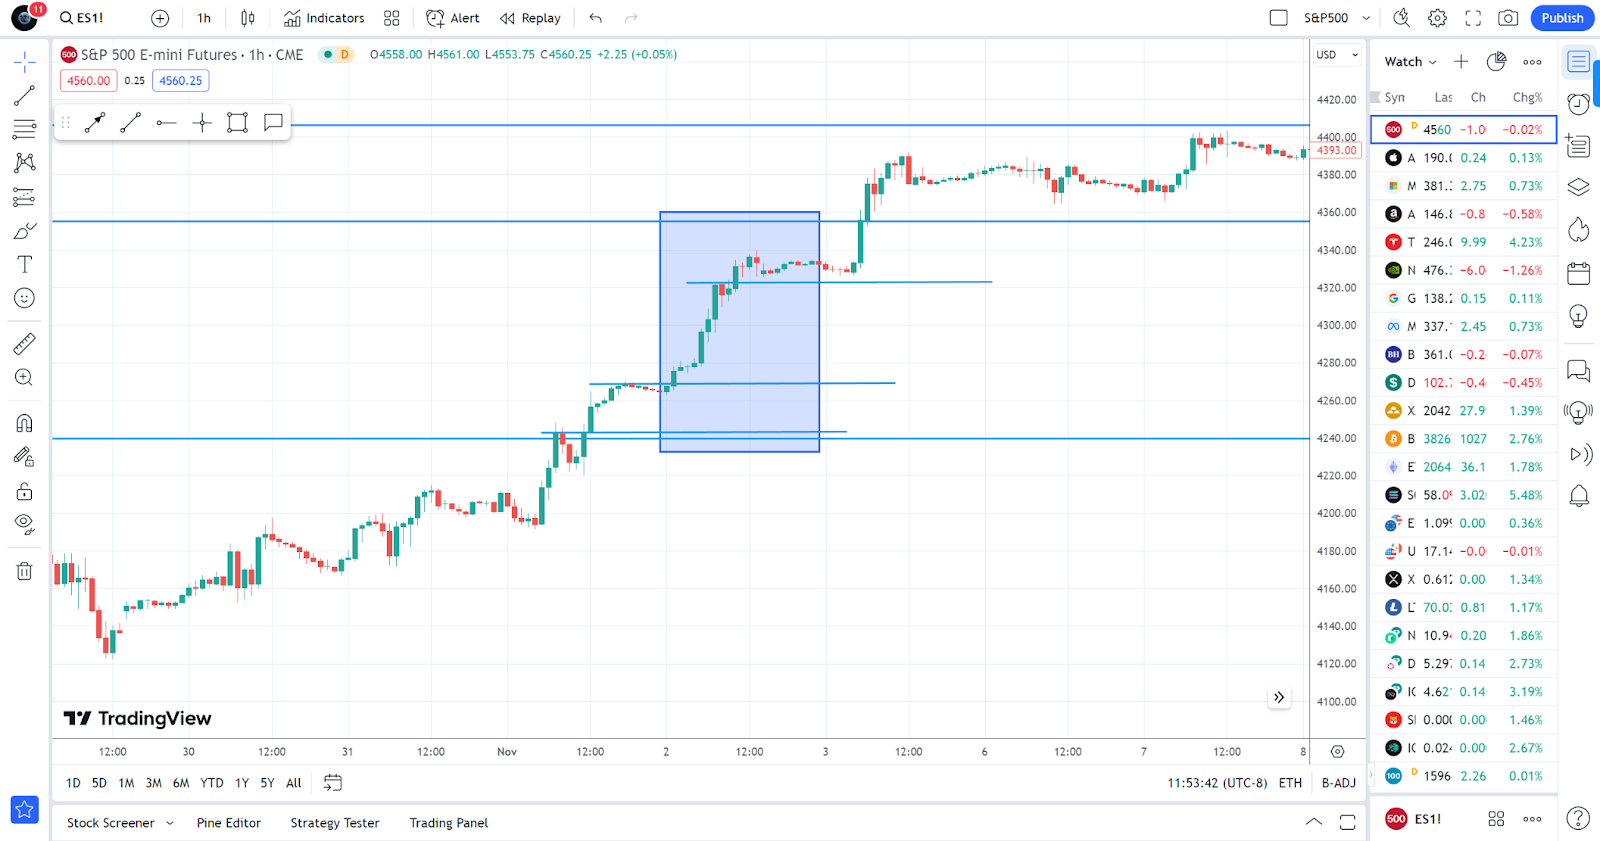
Daily Timeframe
This chart is the daily timeframe and now we will analyze just the movement of that one candlestick inside the blue rectangle. On the following parts of this section, you will have understood what multi-timeframe analyzes is and how to make it work.
The blue rectangle on the candlesticks chart above is the one hour timeframe, containing all 24 candles that make up the daily timeframe movements found in the “daily timeframe” image above. As you will learn later, when we begin discussing structure of the market, this is a good indication through the power of price action that the market has decided to add fuel to move more upwards.
Looking at our previous example just to recap, as you can see, we have a daily candlestick inside the blue rectangle and the movement behind that candlestick on a 1 hour timeframe is created by 24 candles that represent 24 hours of movement, which that movement goes both, upwards and downwards.
In our case, trading the S&P500 Futures market ( ES1 ) we focus on the 2,000 tick chart. Our best bet when looking for direction and the big picture will be the Daily and Hourly timeframes. Those are the timeframes you want to make sure you understand exactly what is happening before you try to execute any trade on the 2,000 tick chart. Looking at the picture below you will see the multi timeframe analyzes breakdown and how it all connects.
Below you will see the daily timeframe, then the hourly with our execution timeframe being the 15 minute. As mentioned previously you always want to trade in the direction of the higher timeframe. Often times you will see opportunities on the shorter timeframe to trade against higher timeframe but it is never advised to do so as news or events can give optimism to investors to keep dumping money for continuation of the trend at any moment.

Daily Timeframe Fully Analyzed with Support & Resistance (S&R)
Above, you see a strong bullish candlestick breaking above the previous support now ( first line in the buttom ) and a huge continuation upwards. This means that the market has great potential to just keep going up, as it did in the following candles until where current price point is at.
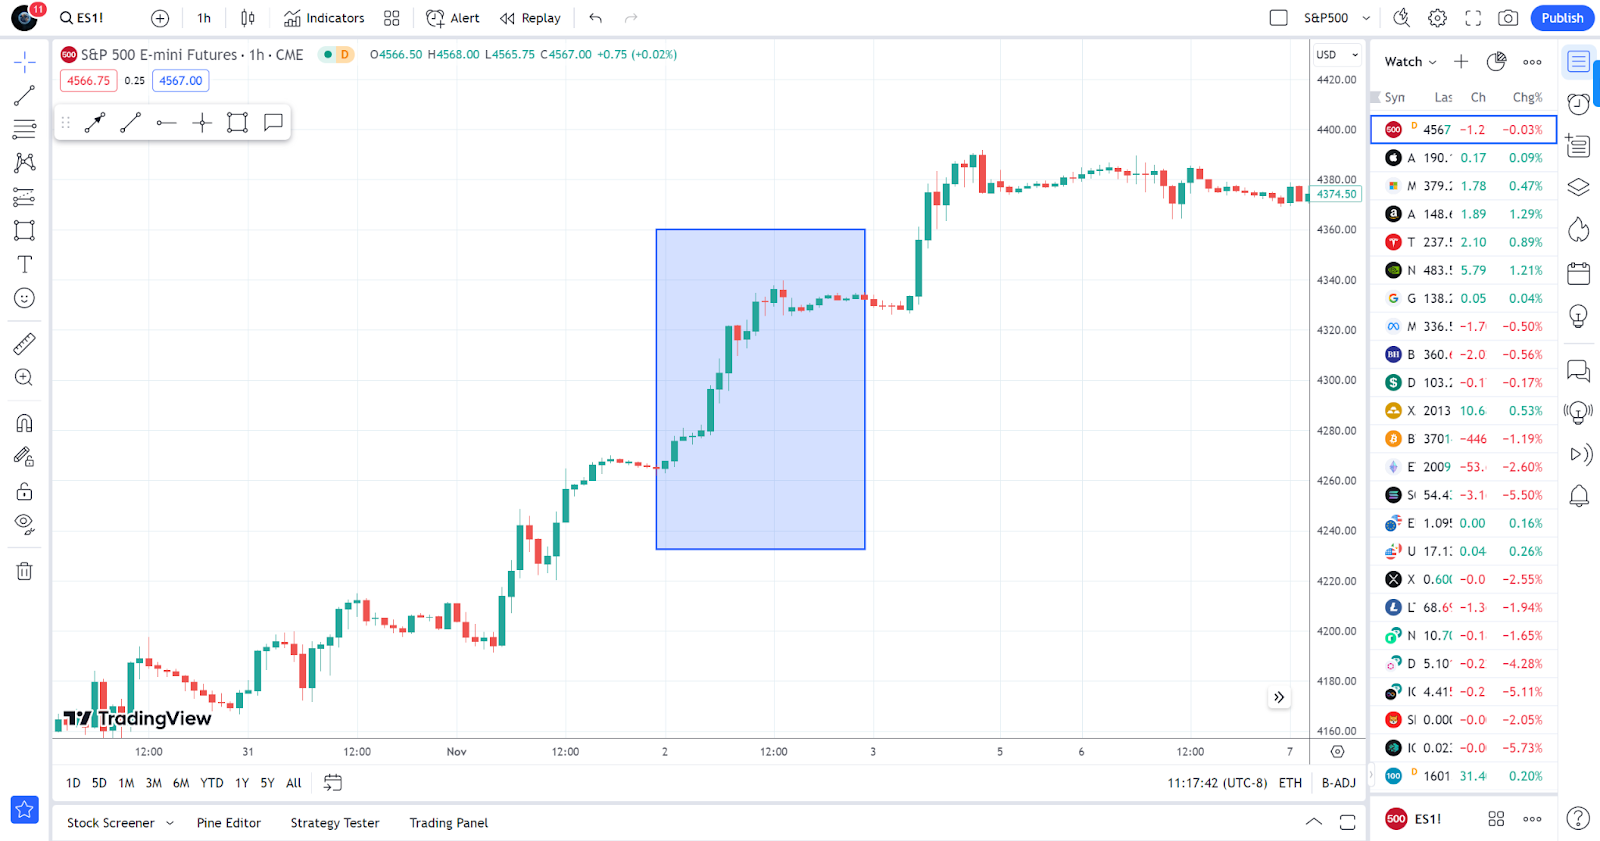
1 Hour Timeframe Analyzed With Added S&R throughout
The daily timeframe shows one candlestick moving up and above us is the hourly timeframe. You can see the 24 hours inside the box and I’ve placed smaller resistance zones in that timeframe because a strong breakout would mean continuation making it a great trading opportunity.
Once we have the daily timeframe analyzed and the one hour as well, as we do in the last 2 images. You can now drop to your smaller execution timeframe, in this case we’re using the 15 minute chart (each candle represents 15 minutes of data as opposed to hourly or daily timeframes ) You can see a clean breakout there and a huge continuation upwards, afterwards.
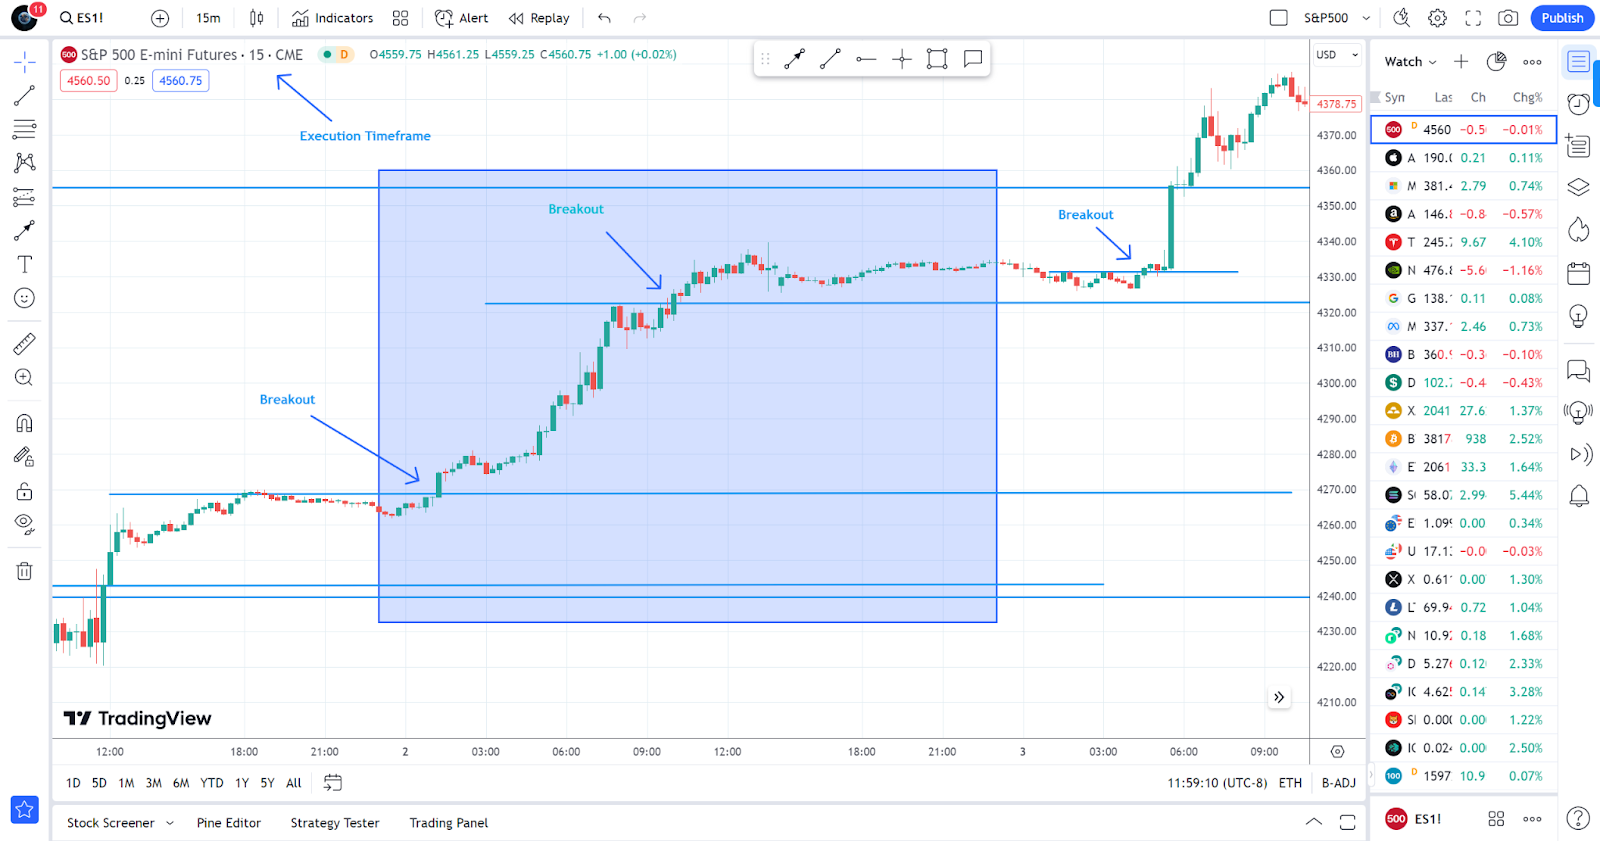
15 Minute Timeframe Fully Analyzed
Where the market says breakout, those are great candlesticks that represent a time to execute a trade. As you can see, we have strong bullish moves in continuation of the market direction and the candlesticks that we’re seeing is the Engulfing candlesticks showing that there is strong movement behind those moves.
Support and Resistance
Now lets talk about how to actually analyze, draw and craft possibilities on a chart. There is an infinite ways to analyze the market, what separates a professional from a gambler is that they have a very clear, highly restrictive trading strategy that they have backtested, trusted and then they try to apply that strategy into current market conditions. They wait for the market to FIT their strategy as opposed to forcing their strategy into the market. Think of it as having a triangle mold in your hand and having to fit that shape into multiple other shapes in the table. The mold is your strategy and the other shapes in the table represents the current market conditions. You must wait for market conditions or the right shape that fits the mold to come through before you risk money on the trade. A gambler or a beginner will test a strategy for 2 weeks and if it doesn’t work, they will adjust or change it. You want to make sure you are executing that strategy correctly to begin with. Often times, we think we know how to do it but we aren’t doing exactly what we think we know.
Support and resistance are lines that we place over the market to help us create structure and see whether the market is trending upwards or downwards. They are historical price points where markets struggled to break above or fall under, they create stagnation on the chart around the same price point multiple times through a long period of time. You can spot that stagnation through multiple candles moving up and down on a very tight price range as you can see in image below.
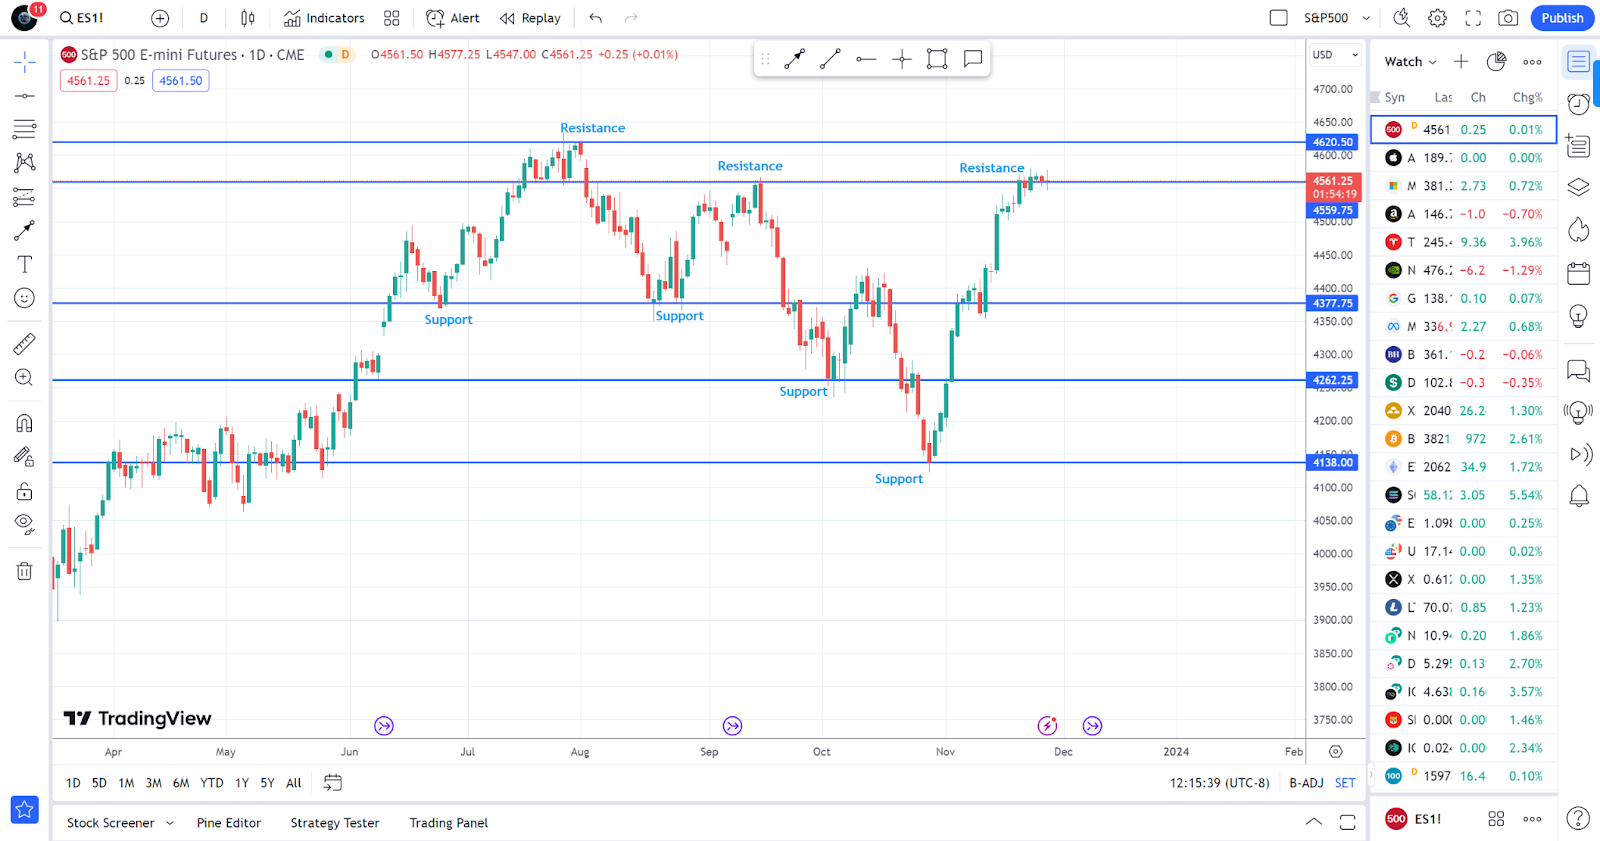
Support & Resistance Levels
Think of support and resistance as the floor and ceiling of the markets current price point. The price is trying to grow as investors become optimistic of the overall health of the economy but they know that historically, it has stolled in some levels, which psychologically means that people are likely to be cautious round there as the past does equal the future here, very often. Think of breakouts of such zones like a baseball game. Someone hits the ball hard with momentum and the other player runs to the other base more safer than not. In the markets, when there is a breakthrough of either resistance or support, it will most likely run towards the other level below or above that. It’s crucial to learn to identify this levels well and stick to trading in between them, all while following the overall direction.
When trading the ES1, you want to spot those level on the daily and on the hourly and ideally you want to change the color of those lines to make sure you know which lines represents which timeframes. As mentioned many times already, you want to follow higher timeframe direction and built up momentum. Professional traders trade between the higher timeframe zones and we avoid trading near those zones as we do not know how the market will react. The market could react very different as big banks and hedge funds begin taking profits or hiting loses, creating a massive disbalance on the market price and therefore consistency.
Keep in mind that when someone sells their buying shares because they take profit, it releases demand of that asset adding to the limited supply of that stock shares which drops the price of it. That is why mastering to identify support and resistance levels well is crucial to trading, which it can take weeks of practice to train your eyes to spot them, but you can become a professional if you put in the work. Personally, I can analyze an entire graph in under 2 minutes, know where the market is heading if anywhere and have a plan to execute trades. Some days, I can finish my day in under 5 minutes, while others it can take up to 4 hours, depending on how many potential opportunities I want to take.
When it comes to trading, as previously mentioned, there are many ways to analyze and break down the markets. The most important things that you have to master are, understanding price action, support and resistance level and breakouts. You do not need any indicators, robots, or even trendlines placed on your chart. Trading indicators are always one of two things, they are either lagging or leading which both have nothing to do with current present circumstances. Using indicators is even worse in high frequency trading as those indicators will always make you question yourself and it will stop you from developing your own inner certanty.
The only indicator I use is the volume indicator because it shows the volume of transactions happening at current or recent times, you will learn about it deeper down below. However, the best indicators will always be mastering the art of support and resistance, understanding price structure, reading momentum, awaiting breakouts of such zones and trusting your instincts. The markets will challenge you in ways you will rarely experience ever in life, one of these ways is developing the belief in yourself and your inner voice and building the courage to place your valuable assets in this case money behind yourself.
“A professional day trader can build any business but a business man will not become a day trader as easily.”
So far you have gotten an understanding of candlesticks, trends, market analyses through support and resistance and top – down analyzes through multi timeframe analyzes. Now, lets get a bit closer to learning and understanding when to actually place a trade and risk your hard earned money.
Momentum
Momentum means there is volume and certanty of a direction by big players on where the market is going at this precise moment, based on the current dynamics at play. You will begin to spot high volume on the volume indicator or through big candle sticks such the ones mentioned in the candlestick subtitle of this article (engulfing or doji.) This means that the sentiment of most trader is aiming towards a certain direction which traders are placing actual money bets on. This will fuel the market to go more in that direction and as scalper, it helps us place trades on short timeframes and profit as we continuously add more fuel to that fire.
However, it is highly recommended to never trade if there is no momentum fueling the market to go a certain direction at the moment. Your best bet to trade will be during the market hours, preferably in the morning pre open, open or within the first 2 hours with a break during lunch hours and continuation after lunch, mostly in the end towards the last hour until close. The close of the market, more often than not, you will see some solid momentum as most day traders exit their position to avoid fees or next day market open gaps. This last hour or so, you will see volatility due to everyone closing down their positions which builds a disbalance between supply and demand of shares.
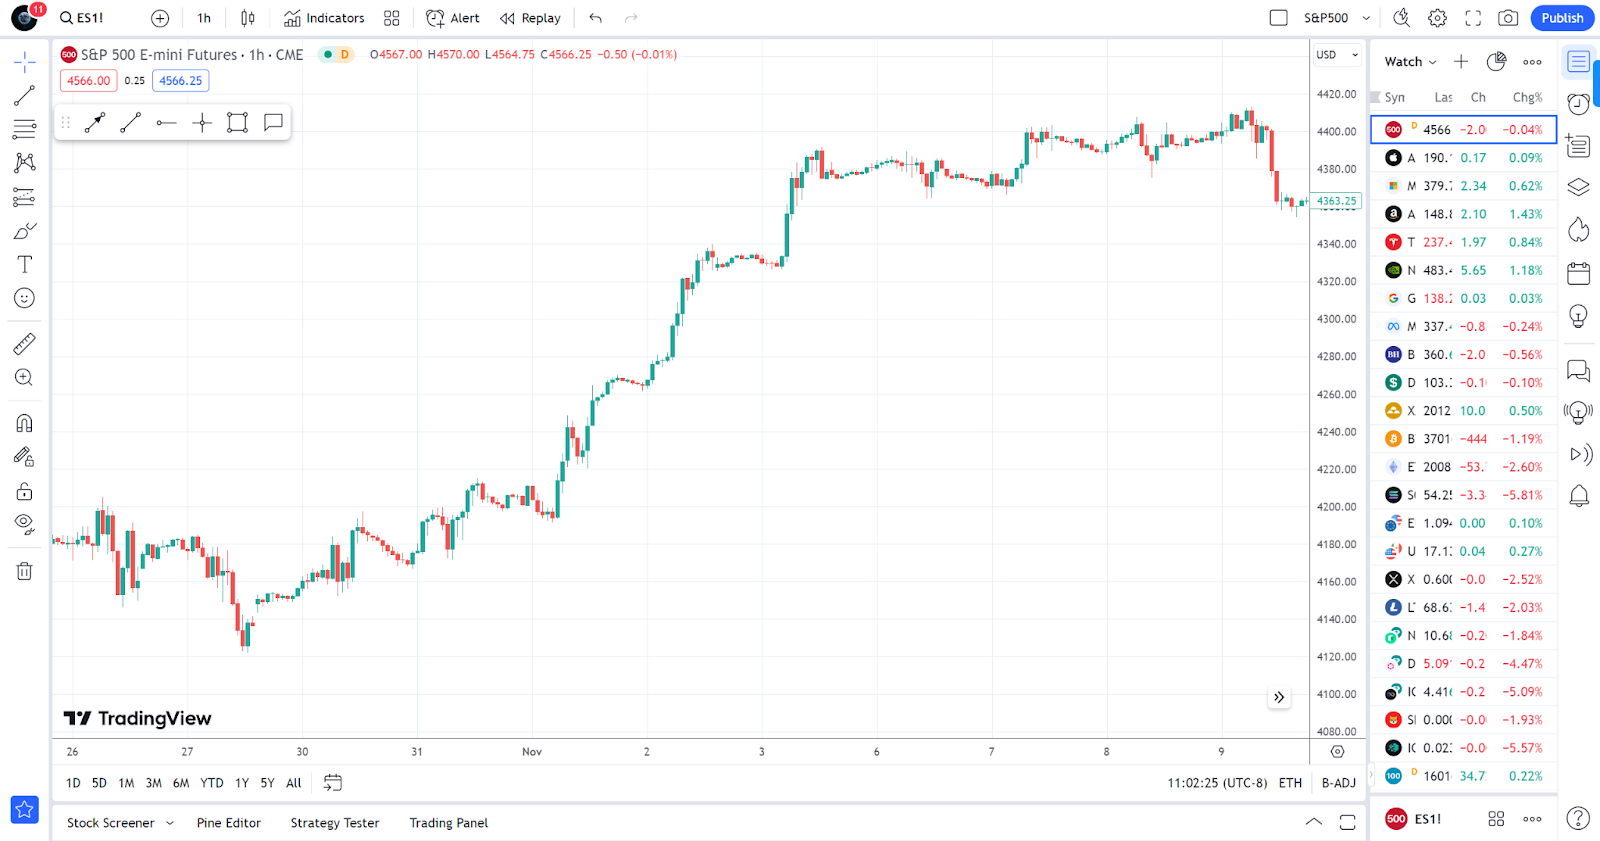
Inside those blue boxes you can see engulfing type of candlesticks moving in the overall direction of the market. Those will be key to master identifying as few things will give you a better trade confirmation in this market than those candlesticks in those trend continuation breakouts.
Volume
The volume indicator is key to identify the volume of market transactions and nothing else. Most people think that seeing a big spike on the volume indicator through a certain candle direction, means that the market will move in that direction which is not always true. A big spike means that based on the last couple of hours, the market has been slow and at that precise candle, day traders have begin to place trades. Spotting a doji candlesticks could mean big hedge funds executing on a swing trade in the opposite direction in a higher timeframe from the one that you’re seeing, Doji means that there is a fight about who takes over the market direction. This happen particularly around key levels of support and resistance.
The best way to use the volume indicator is to be aware that there are players coming into the market and it will build momentum towards the current trend direction or completely shift it. If you are in the middle of a higher timeframes S&R levels, chances are high that it will fuel the movement towards the other zone and if you’re near it, it might cause a breakout for further continuation or a rejection to begin dropping to the previous zone. Big volume spikes is just to bring awareness of market movement, it is important to remain calm and play logically by ensuring the market fits into your trading strategy.
The best trades using the volume indicator are those where you find small to medium volume bars being created and big candlesticks in the chart. That signifies that most of the trades placed were in the direction that the candlestick is going.
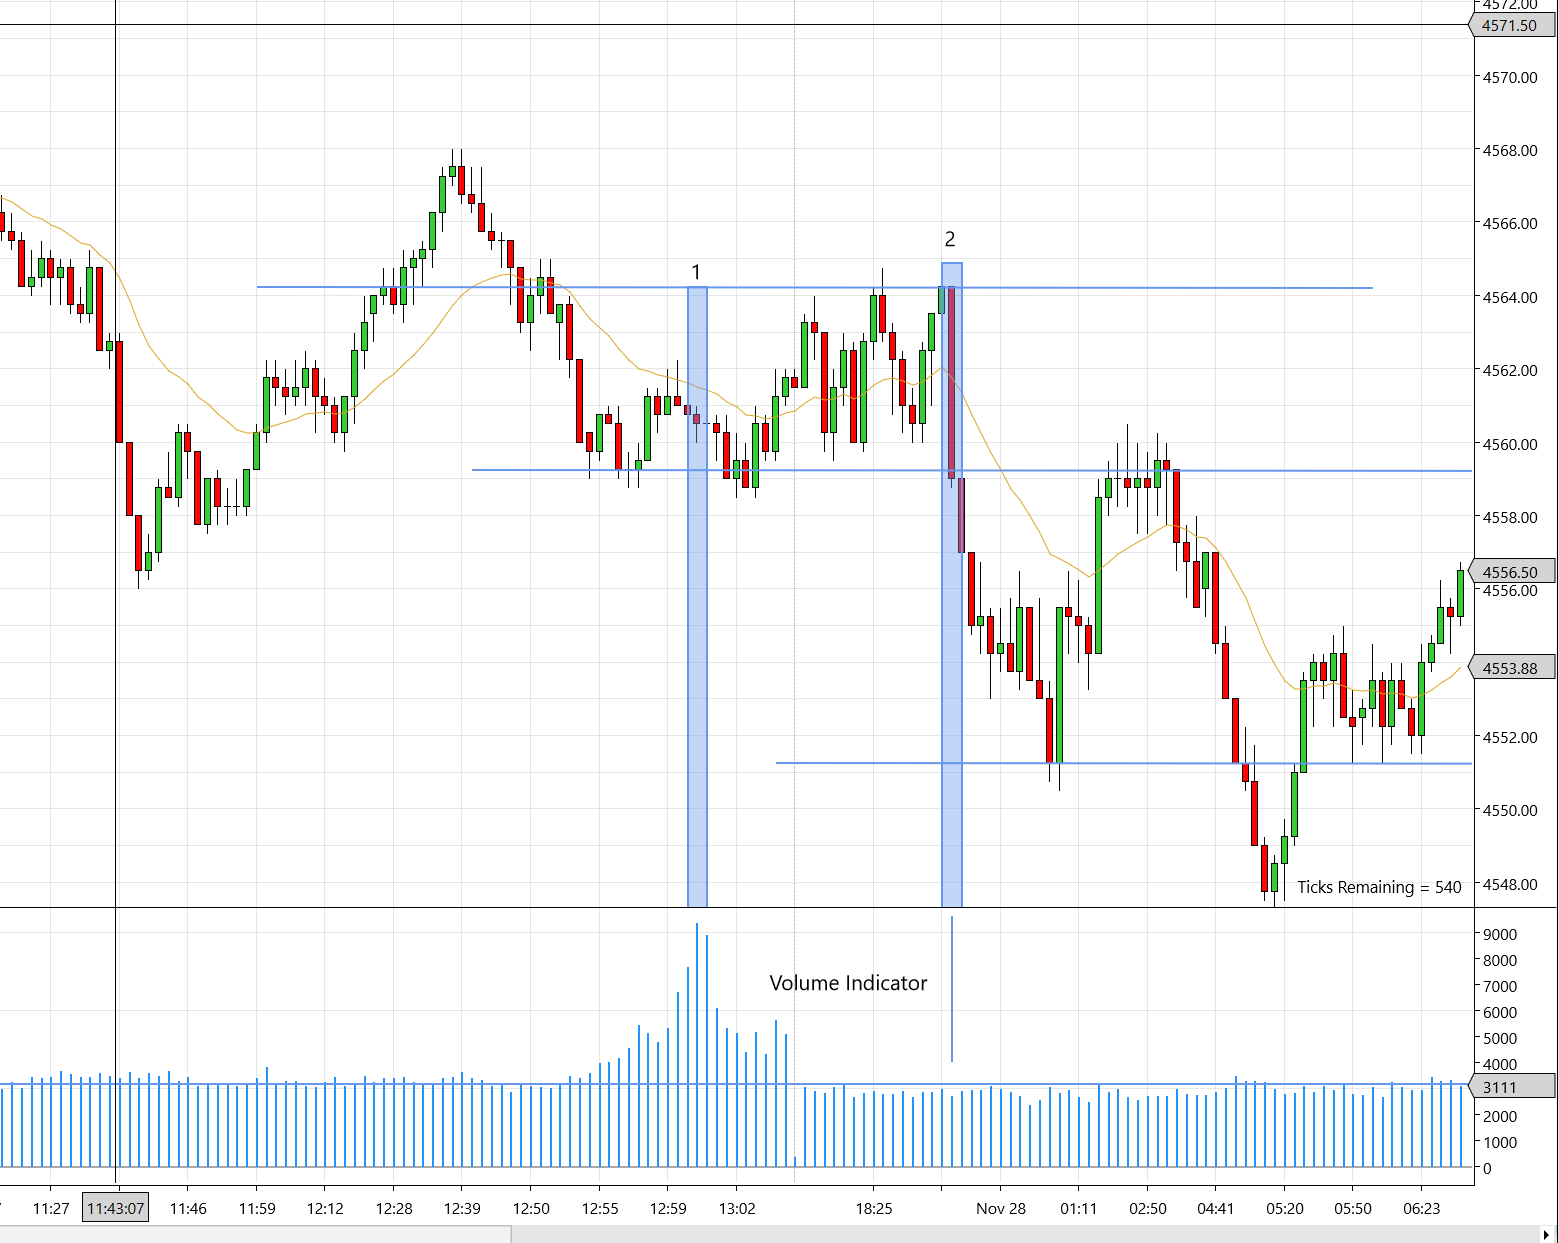
As you can see, in the candlestick that is inside the blue rectangle, labelled 1 is very small, yet the volume indicator is extremely high at the bottom. This signifies that lots of institutions and traders placed orders at that point and it was a very tight battle of buyers and sellers that hardly moved the market. Rectangle 2 shows a big candlestick with very low volume at the bottom, meaning that the huge majority of traders decided to sell the market. That low volume bar, means low transaction amount and the big candle signifies it mostly went for sells. This chart is the 2,000 tick chart, in that rectangle number 1, most of the transactions could of happened in a higher timeframe and therefore we saw the continuation of the trend downwards in square 2 in the smaller timeframe of 2,000 ticks.
Entry Points
You’ve learned most of the things about trading the markets so far, now the only thing missing is how do I know when to place the actual trade? Although I’ve already covered some of this in the Multi Timeframe analyzes part, we’ll dive deeper here. This is the Million dollar question, as you could have done every single things correct in your analyzes, being patient for market to reach key levels, seeing it bounce off ley zones or breakthrough them and still execute a few candles or seconds late or early and giving you a lose. Your trades risk to reward should be set appropriately and in scalping markets, bringing your stop loss too close or far out to the trade entry, cuts off breathing room for the trade to play out.
One key thing to always keep in mind is that the moment you execute the trade, you will have negative balance because of market fees, spreads and the like. You can NOT let seeing your trade in the negative scare you or make you question your decision. I can not tell you how many times the trade was a quarter point away from hitting my stop loss only to reverse into hitting my take profit. That is why having high emotional tolerance, trust in youreslf and certainty even when things don’t go your way is a very key component to whether you can trade profitably over the long run or not. As talked about in the psychology part of this article, you must know your motives about why you are trading and wanting to make money as they will get in the way of your trades if you choose to lie or ignore your real deep motives to yourself. The best traders do not have a real affiliation to money, they genuinely love the art of day trading the markets, from charting up zones, understanding trends, the motive behind those moves and crafting possibilities for the future through data that comes from economic or world events.
Now lets dive into the actual time to pull the trigger.
If you’re following every step of this article you have understood the key components of my trading strategy for the SP500 (ES1). Now lets put it all together, shall we?
When we open up the chart, we begin by analyzing what is happening on the higher timeframe which in our case, we start in the daily timeframe. We start placing support and resistance levels throughout the chart and understand the overall direction that the market is giving us. You do this by identifying whether the market is creating a structure of higher highs (if direction is upwards) or a structure of lower lows if the market is going downwards, as you can see in the image below.
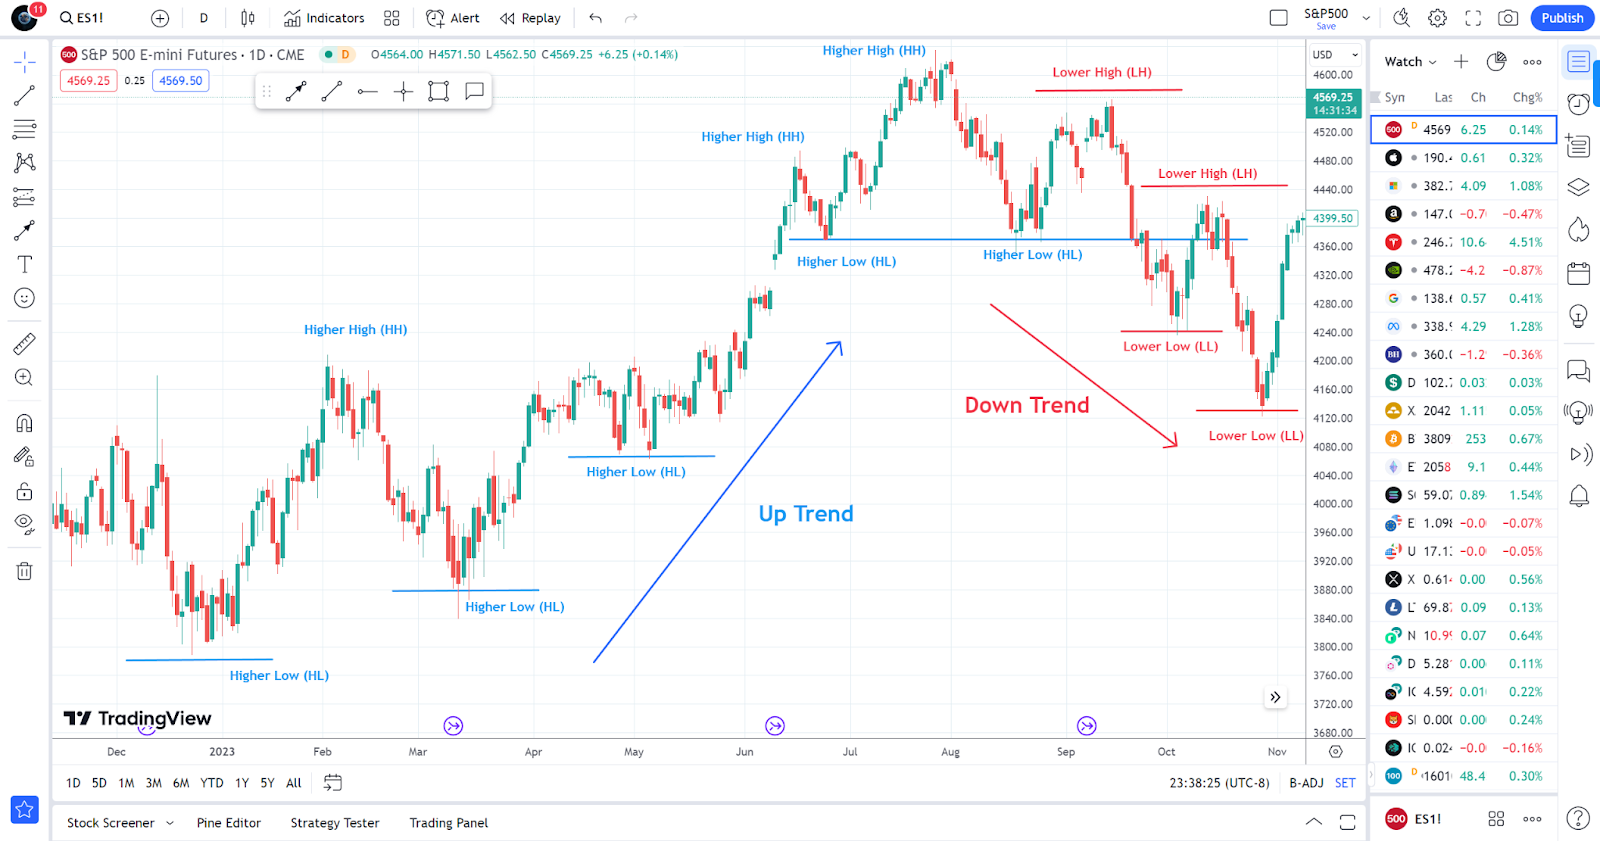
Daily Timeframe Showing Higher Highs & Lower Lows.
Once you understand the overall market direction on the daily timeframe and where it has the highest probability of moving towards. You want to drop into the lower timeframe of 1 hour to begin spotting the same patterns there and begin building alignment in the overall market direction from higher to lower timeframe. Below we will begin analyzing trading opportunities based on the markets move within the blue rectangle, highlighed as single daily candle.
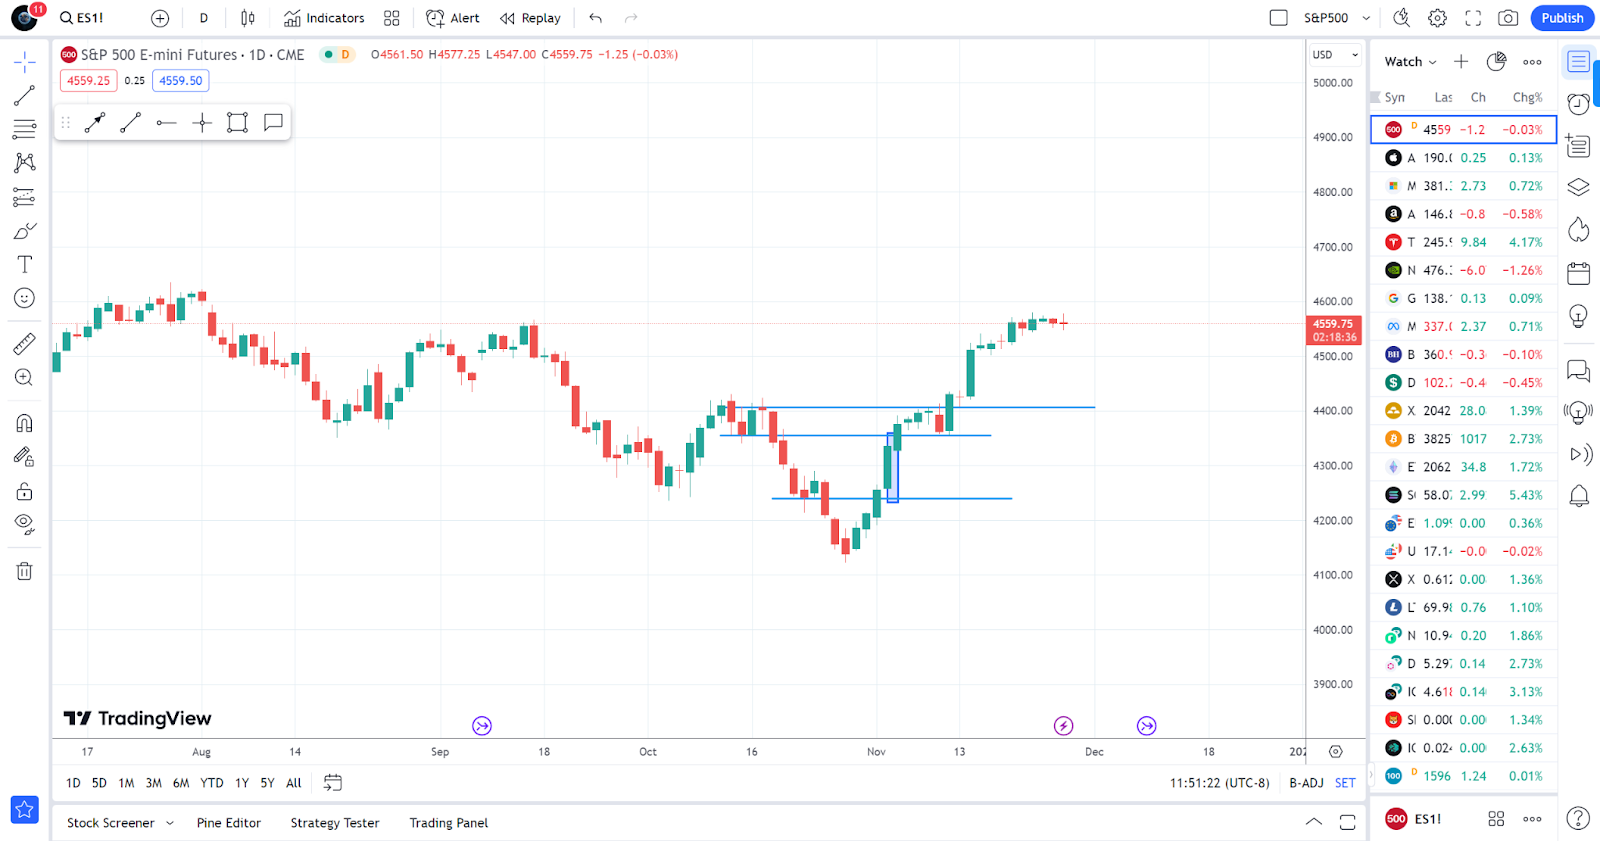
Daily Timeframe Analyzed For Trading Blue Candle Day.
Above you see a strong bullish candlestick breaking above the previous support, now turned resistance. (first line at the buttom) and a huge continuation upwards. This means that the market has great potential to just keep going up, as it did in the following candlesticks until current price point is at.

Hourly Timeframe Analyzed For Deepening Understanding Of Blue Candle Day.
Inside the blue box there are 24 candles, each now representing the hourly timeframe. Prior to price entering the blue box, we can see that the market was already generating higher highs and higher lows. We saw a big break of the daily resistance level (Buttom long horizontal line) which meant that the market might continue going up. Afterwards we saw it drop and breakthrough again but in the hourly timeframe, signifying a confirmation of moving up. Now, we want even more confluence and so we wait by letting go of that trading opportunity and for the market to stalled again while in between the zones so that we can just ride from the support level to the new resistance level.

15 Minute Timeframe Analyzed For Trading Blue Candlestick Day.
Once we have the daily timeframe analyzed and the one hour as well, as we have done in the last 2 images. You can now drop to your smaller execution timeframe, in this case we’re using the 15 minute chart (each candle represents 15 minutes as opposed to a day or hourly amount of data) where you can see a clean breakout of created resistance while already moving from daily support to daily timeframe spotted resistance. In the 15 minute timeframe, there is a huge continuation upwards after breaking through.
Once you’ve identified a direction that aligns in both timeframes, the daily moving upwards and the hourly moving upwards as well. You will begin to look closer to the last couple of candles, this can range from 3 to 8 candles, to tell the story of where momentum is and if the market is ready to explode in any direction. Ideally if you see the daily timeframe break above an important level, you could expect a take off into the next one.
The market will always move from zone to zone, the key thing is training your eye to spot short market reversals as it reaches those zones because it will never just move directly in a certain direction, the market moves in waves. A key thing to keep in mind is to wait for higher timeframes to get established before engaging yourself on the smaller ones. When it comes to trading the candlestick chart, you will always want to wait for the close of candlesticks before placing your trades. The candle can easily break above your resistance level, but the key is to hold above that level in order to consider it an appropriate breakthrough.
Attached to this article, you will see a link to a trading video that I’ve created. I must say, it is worth taking notes and going over it many times as this can be a very solid guide to trading the S&P500. The only thing left to do will be developing yourself to have the patience, emotional tolerance and training your eye to spot this patterns fast.
Risk & Trade Management
Great, you’ve placed your trade. Now what? The key to trading profitably long term is actually on your ability to have a consistent risk to reward ratio and trade management system for every single trade that you place. If you were to be trading a 1,000 dollar account, you would not want to risk more than 3 percent on a single trade. 3 percent of 1,000 dollars is 30 dollars per trade, if you lose 3 trades in one day, you would be down by around 110 dollars or more than 10% of your total account as 3 percent compounds negatively. This would impact your trading account substantially as you can see, having a 10 percent or more lose on a single day. \
The best traders who have a consistent risk to reward of 2 to 1 meaning for each trade they place they are looking to make 6 percent on their account or in this case 60 dollars while losing only 3 percent or 30 dollars. The people who usually risk 3 percent on their account are those who have already backtested their strategy for months and trained their eyes to spot the patterns and have mastered their emotions.
I usually recommend beginners to risk no more than 1 percent of their account as the key to learning initially is not on making money but analyzing the market properly and trusting yourself with your analyzes.Most beginners have not developed the emotional tolerance to admit they are wrong or are have a negative characteristic trait of being afraid to make mistakes. This is especially true of people who come into the trading world from a corporate world, where most people feel threatened to break something as their reputation or entire jobs could be in the line. Risk management will always be what differentiates long term successful traders from an amataur and emotional gamblers. You must understand that mastering trading will take time and being an amataur is part of the journey but can not let that discourage you.
Fundamental Analyzes
Fundamental analyzes can definitely create a bigger edge over the markets as you will be able to see economic data and how it impact the economy. This means understanding consumer spending, unemployment and interest rates, CPI, PPI, Home Sales, among other key things.
One of the best ways to learn this now, is by heading over to Fxstreet.com, filter out everything outside the united states and the medium to high impact news and going into chatgpt website and begin asking it to give you descriptions about each of the fundamental economic data releases from the united states and engage in that conversation.
It will be a lot to memorize so it is recommended to take notes and not to rush it. I write this part last, because it can be a great addition to understand the macro aspect of things as it will allow you to predict what news will create market reversals or even retracements while moving from one zone to zone and it will allow you to plan your trades accordingly.
For example, if I know the Unemployment rate will be released on Thursday and the market is over extended from the buyers side and it is nearing a critical level. I can predict that those news might cause a drop, so it will be good not to trade or begin setting your eyes for the potential zones that it could reach so that you can continue trading on the overall new direction.
Understanding market economic data releases and speeches plus its release times can significantly improve your trading. Aside from economic data, you have to understand the key companies moving the markets, which are the magnificent 7. Meta, Amazon, Tesla, Nvidia, Microsoft, Apple, Alphabet. This companies make up nearly 30 percent of the relevance of the S&P500. Apple buys a new startup every other day throughout the world and their product launches are some of the most advertised and hyped up which creates massive anticipation. Predictions tend to make investors optimistic so they try to buy in early boosting apple stock based on hype then it drops once they realise product as sales don’t match the hype.
Fundamental analyzes however is not truly needed to begin trading, because there is a whole mindset and character traits you must develop and that can only happen by analyzing charts, placing trades and taking loses. Many people without knowing anything about fundamentals have been able to make thousands per month day trading short time frames as our job is simply to spot direction, momentum and breakouts. People who are investors such bankers and those responsible with retirees money have to be more certain about the real state of the economy before doing any trading at all. Anything above a day trader, such swing trader, long term trader or investor have to know this information otherwise this events and economic releases will mess up their trading.
Now that you’ve learn a very straight forward overall view of how to day trade the S&P500, I want to congratulate you for reading this far and embarking on one of the most exciting, character building ventures you can possibly undertake. I invite you to read this article at least twice per week and watch the youtube video I created for you guys every week for the next three months. You have to master this very key principles if you expect to get anywhere in day trading any market, from stocks, crypto, or forex. Also I must mention, looking for information in many places will simply make you adjust or change strategies often. Give yourself some time with one, read this many times and practice training your eyes to spot key levels, trends, momentum and proper retracements for great trade entries in continuation of the overall trend.
About The Author
Jobany currently trades a multi 6 figure trading account only scalping the S&P500 index, generating over 2 percent returns per week. He has over 3 years day trading experience with the Forex markets and was mentored by some of the best independent day traders whom previously held positions at big banks managing Billions of dollars. Besides day trading, he is building a kids educational tech startup empowering children to develop themselves with fun extracurricular activities and a safe social community for them to engage in called Kidduz. He loves helping others and engaging in intellectual conversation about the world and its innovation. Currently resides in the San Francisco Bay Area and enjoys exploring coffee shops.